- Published: 24.12.2019.
An Overview of the Real Estate Market of the Republic of Croatia

Ministry of Construction and Physical Planning published the publication ‘An Overview of the Real Estate Market of the Republic of Croatia 2018ʽ. It is the second edition of the publication, which is published by the MCPP in cooperation with the Institute of Economics, Zagreb (EIZ). The first edition of An Overview of the Real Estate Market of the Republic of Croatia was published in September 2018. It covered the period from 2012 to 2017.
The basis for developing the publication is the Real Estate Valuation Act (Official Gazette 78/2015), which by Article 20 obligates the Ministry to publish, at least once a year for the previous year, an overview of the real estate market of the Republic of Croatia.
- An Overview of the Real Estate Market of the Republic of Croatia 2018
- Summary of the Publication (pdf)
The main goal of the publication is to provide the public with basic information and trends on the real estate market, which is a significant contribution not only to a higher quality of evaluation, but also to market transparency. By this Overview, every citizen is enabled access to the state and trends on the real estate market, both at the national level, as well as at the level of individual counties and local self-government units. The publication is also a basis for making decisions regarding the disposal and management of real estate by all subjects concerned in our country. An Overview of the Real Estate Market of the Republic of Croatia 2018 will enable public policy makers to develop a more successful definition of public policies, instruments and measures aimed at those activities that to a significant degree use a specific type of real estate as a production factor in their business. Although it does not abound with strategic raw materials and energy sources, Croatia possesses quality space and environment, and it is desirable that every approach to development is based on a more rational and economical management of space.
Data presented in the Overview
An Overview of the Real Estate Market of the Republic of Croatia 2018 shows the state of the real estate market in 2018 and the annual change of selected indicators in relation to 2017, at the level of the entire country, counties and individual local self-government units, and for the City of Zagreb including also the level of the cadastral municipality. The Overview distinguishes the following types of properties: apartments (including rental apartments), family houses, business real estate, building land, agricultural land and forest land. The basic indicators that are shown for each type of real estate are the average (median) sale price and the average (median) size of the real estate. For apartments/rental apartments, family houses and business premises, the average (median) age of the real estate is also shown. In the last chapter, the value of the affordability indexes of the real estate by local self-government units for 2017 is also shown, as well as the relations between real estate prices and demographic indicators, and between real estate prices and tourist activities.The electronic tabular annexes of this overview contain median prices of real estate per m2 and the number of real estate transactions for the entire 2012-2018 period, at local self-government unit level. In the electronic attachment also all pictures shown in the Overview are available.
When interpreting the selected indicators of the real estate market that are presented in the Overview, the fact should be taken into account that real estates are not homogeneous assets, which means that there are no two identical apartments, two identical houses, two identical business premises or land plots. In calculating the average price and the average transaction value for each type of real estate, the fact is neglected that every real estate has unique characteristics which also affect the final purchase price, and this contributes to the high variability in the values of the observed indicators. In order to indicate the variability of indicators, their distribution ranges represented by the 5th, 25th, 75th and 95th percentile were used. Furthermore, for purposes of data confidentiality protection, for local and regional self-government units in which less than ten transactions were achieved, the values of indicators are not shown.
8.4 percent of GDP in 2018
In the real estate market in 2018, 104,871 transactions were realized, which represents an increase by 5.2 percent as compared to 2017 (Figure 1.). The largest number of transactions relates to agricultural land transactions, 38,461, which represents 36.7 percent of the total number of transactions. They are followed by transactions of apartments/rental apartments, realized in the amount of 23,736 or 22.6 percent of the total number, and by 15,750 transactions of construction land (15.1 percent of total transactions). The total value of real estate sold in 2018 was HRK 32.2 billion, which represents 8.4 percent of the gross domestic product (GDP) of that year (Figure 1.). As compared to 2017, the value of real estate sold increased by 1.4 percent in 2018. Apartments account for the most significant share in the value of transactions in the real estate market in 2018 with 41 percent of the value of contracted transactions, followed by construction land with a share of 19 percent, and family homes with a share of 17.8 percent.
Figure 1.: Number of transactions and value of sold real estate in millions of HRK in 2017 and 2018
Sources: EIZ and MCPP
Purchase and sale transactions of apartments/rental apartments are more often in urban centres, of construction land in Adriatic cities and municipalities, while in the rest of Croatia agricultural land transactions are dominating.
According to the number of purchase and sale transactions realized in 2018, the City of Zagreb stands out with 14,719 purchase and sale transactions, followed by urban centres in coastal areas, e.g., Split with 2,351 transactions, Zadar with 1,870 transactions, and Rijeka with 1,786 purchase and sale transactions. Most transactions relate to purchase and sale of apartments/rental apartments. The fact that there is more intense trade in real estates in a smaller number of local units is also indicated by the information that in 2018, 50 percent of all transactions (the City of Zagreb excluded) took place in somewhat less than 14 percent of local units. Differences between local self-government units regarding the type of real estate that is mostly traded also reflect differences in the degree of development and structure of the economy of a particular area. Apartment/rental apartment transactions are more common in urban centres such as Zagreb, Split, Rijeka, Osijek, Dubrovnik, Zadar and Šibenik. Buying and selling of construction land predominates in the coastal zone outside larger urban settlements, and in parts of the hinterland of Istria and central Dalmatia. The rest of Croatia is characterized by the dominance of purchase and sale transactions of agricultural land.
The most expensive apartments in Dubrovnik
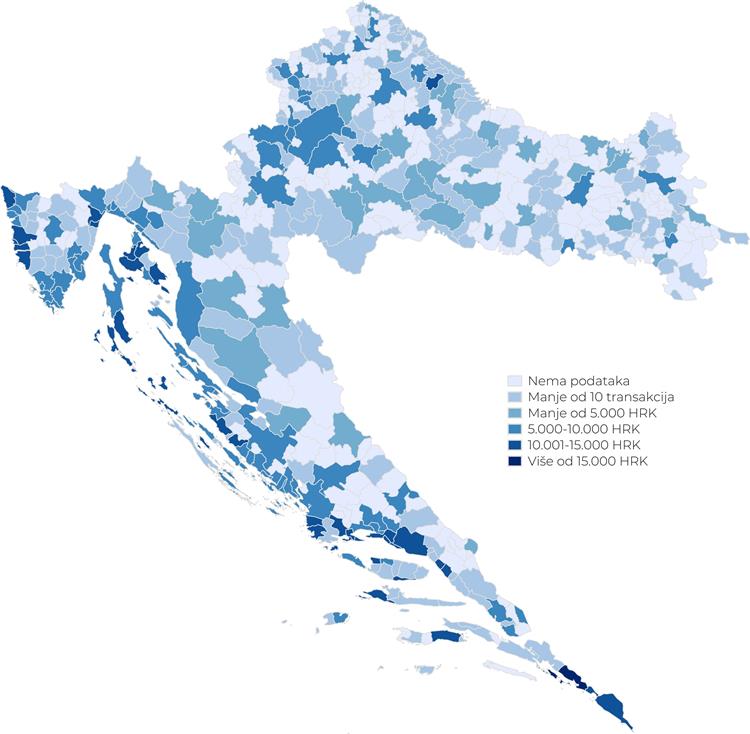
A median apartment/rental apartment price in 2018 exceeding HRK 15,000 per m2 was recorded only in Dubrovnik. A median price in the range of HRK 10,001 to 15,000 was recorded by 32 local self-government units, this exclusively concerning coastal and insular local self-government units (Figure 2.). The City of Zagreb, with a median price of apartment/rental apartment per m2 of HRK 9,459, was classified in the category with a median apartment price between HRK 5,001 and 10,000 per m2, and there are 87 other local self-government units in this category. Rural areas and most local units in the central and eastern parts of the country, i.e., 37 cities and municipalities in total, are characterized by median prices per m2 of HRK 5,000 and below.
Family houses in the Adriatic local self-government units are more expensive than houses in the continental part of the country
When it comes to family houses, significantly higher sale prices are achieved in Adriatic cities and municipalities. Thus, the highest median prices, above HRK 10,000 per m2, were recorded in Dubrovnik (HRK 12,139) and Župa dubrovačka (HRK 10,339). The median price of houses ranging from HRK 5,000 to HRK 10,000 per m2 was recorded in 29 cities and municipalities, in coastal and insular local units. Furthermore, out of the total of 87 cities and municipalities in the category of median prices of houses ranging from HRK 1,001 to HRK 5,000 per m2, as many as 81 are located in Adriatic Croatia, while only six units are located in continental Croatia. Prices from HRK 1,000 per m2 and lower can be found in as many as 190 local self-government units that are mostly located in rural areas of the continental part of the country. For 1 m2 in Dubrovnik-Neretva County it was possible to buy as much as 26.7 m2 of a house in Vukovar-Srijem County.
Figure 2: Median price of sold apartments/rental apartments per m2 in HRK per local self-government units in 2018
Sources: EIZ and MCPP
Agricultural land most expensive in Adriatic local self-government units, the cheapest in Slavonija
Also in 2018, agricultural land was most expensive in the Adriatic local self-government units. In 11 local self-government units, the median price of agricultural land was higher than HRK 1,000 per m2, namely in Okrug, Dubrovačko Primorje, Trogir, Dugi Rat, Župa dubrovačka, Podstrana, Tar-Vabriga, Baška, Marina, Sućuraj and Solin. In 23 Adriatic local self-government units, the median prices of sold agricultural land ranged between HRK 51 and HRK 100 per m2. In 437 local self-government units the median prices per m2 of sold agricultural land amounted to less than HRK 50. Among the counties in continental Croatia, the highest median price of agricultural land was recorded in Vukovar-Srijem County, amounting to only HRK 4 per m2. In other continental counties, the median price per m2 of agricultural land ranged from HRK 1 in Bjelovar-Bilogora County to HRK 2.9 in Krapina-Zagorje and Zagreb County. An exception is the City of Zagreb with an achieved median price of agricultural land of HRK 19.3 per m2.
The most expensive building land in the Central and South Adriatic
A median price of building land exceeding HRK 500 per m2 was recorded in 47 local self-government units, namely in cities and municipalities located in Dubrovnik-Neretva, Istria, Primorje-Gorski Kotar, Split-Dalmatia, Šibenik-Knin and Zadar County. In only seven local self-government units the median price of building land was higher than HRK 1,000 per m2, namely in Milna (HRK 1,635), Biograd na Moru (HRK 1,497), Brela (HRK 1,333), Stari Grad (HRK 1,129), Bol (HRK 1,126), Hvar (HRK 1,116) and Podstrana (HRK 1,035). In 117 mostly Adriatic local self-government units, the median price of building land ranged from HRK 101 to HRK 500 per m2. Prices of HRK 100 per m2 and lower are mostly observed in rural areas and in central, northwest and eastern Croatia. A median price of building land below HRK 10 per m2 was recorded in five local self-government units, in Petrijevci, Lipik; Velika, Mač and Markuševac (Varaždin County).
The most expensive business premises in Dubrovnik, Makarska and Novigrad
The highest median prices per m2 of sold business premises are recorded in three Adriatic cities, Dubrovnik (HRK 14,862), Makarska (HRK 13,383) and Novigrad (12,477). These cities are followed by the cities of Umag, Zadar and Split with median values that range around HRK 9,000 per m2. Median prices from HRK 4,000 to HRK 8,000 per m2 were recorded in 16 cities, including the City of Zagreb (HRK 7,428 per m2) and Osijek (HRK 4,511 per m2). A median price similar to the one in the City of Zagreb is also recorded by cities bordering it, such as Velika Gorica, which in 2018 registered a median price of business premises amounting to HRK 7,260 per m2. Cities and municipalities from Slavonian counties belong to the category of HRK 4,000 per m2 and lower.
Apartments/rental apartments least affordable in the coastal area
Figure 3. shows the index of affordability by local self-government units for 2017. The affordability index was obtained by putting into ratio the median prices of apartments/rental apartments per m2 in 2017 in local self-government units and the average annual reported realized net income per employee, and by multiplying this by 100. The highest values of the affordability index, which also reflect the smallest affordability of the apartment or rental apartment, are recorded in the coastal part of the country. For example, values of the affordability index of 40 percent and more, which indicate that for one m2 of apartment/rental apartment more than 40 percent of annual income is needed, are observed in two local self-government units, Baška Voda and Podgora. The category in which for one m2 of apartment/rental apartment an average of 30 to 40 percent of the achieved annual net income was required comprises 19 cities and municipalities. These are Tisno, Hvar, Bol, Korčula, Sukošan, Okrug, Makarska, Dubrovnik, Malinska-Dubašnica, Primošten, Punat, Novalja, Sutivan, Baška, Brela, Omiš, Tribunj, Vodice and Konavle. In 20 local self-government units with the lowest affordability in relation to the average annual income, citizens could buy between 2.2 and 3.4 m2 of housing space. Among the first least affordable 80 local units there are no settlements that are not located in the littoral. Only at place 81 Jastrebarsko is ranked with an index value of 19.3. The City of Zagreb is ranked only on place 96 with an index value of 16. On the other hand, among the 20 most affordable local self-government units, besides Istrian Pazin and Raša, only units from the continental part of Croatia are ranked. The most affordable apartments/rental apartments are in Petrinja, where the affordability index is 6.7, followed by Beli Manastir, Vukovar, Ogulin, Duga Resa, Sisak, Nova Gradiška and Vinkovci. In 20 local self-government units that record the most affordable residential real estate, employed citizens can buy for their annual income between 8 and nearly 15 m2 of living space.
Figure 3.: Affordability of apartments/rental apartments per local self-government units in 2017
Sources: DZS (Croatian Bureau of Statistics), EIZ and MCPP